Monitoring a Multi-Inverter SolarEdge System

A friend of mine recently had a solar panel system installed on his acreage. Besides being interesting because of the renewable/green aspect of the project, the system itself—from SolarEdge—is actually highly digital.
- A mobile app is used for commissioning the system.
- SolarEdge operates a cloud service which collects telemetry from the system and reports various performance metrics in a user-friendly dashboard.
- The inverters can connect to the IP network and provide a means to collect telemetry from them directly.
The last point interested me the most because any time a device exposes its data or a control connection, it means there's an opportunity to integrate it with other software. In this case, I wanted to create my own dashboard to display (near) real-time performance data for the system.
Whereas other blogs and articles on this topic describe how to monitor a single inverter system, this post will describe how I built a performance dashboard for a multi-inverter system.
Not reinventing the wheel⌗
One of the most detailed and useful resources I found while researching this was Nelis Oostens' blog post, SolarEdge SE3000H monitoring. In it, Nelis explains in detail how to build a monitoring solution using Telegraf, InfluxDB, and Grafana running on a Raspberry Pi. Nelis provides working config files, working code, and even the Grafana dashboards. But additionally, Nelis explains a lot of oddities about the SolarEdge system which impact data collection. Nelis' blog post is required reading for anyone wanting to monitor SolarEdge inverters.
I took inspiration and some artifacts from Nelis to bootstrap my own monitoring solution (thank you Nelis for the permissive license on your content!):
- The Telegraf + InfluxDB + Grafana software stack
- The
solaredge_modbus.confandsolaredge_cloud.conffiles for configuring Telegraf. - The
solarEdgeCloudScraper.pyscript for ingesting historical data from the SolarEdge cloud service. - The Grafana dashboards.
Where I deviated was:
- Used IOTstack to install and launch the software stack inside of containers.
- Running an older version of InfluxDB (because that's what IOTstack supports). This older version does not support buckets or the command syntax from Nelis' post.
- Modified the Telegraf config and Grafana dashboard to support collecting and displaying data collected from two inverters.
Solution architecture⌗
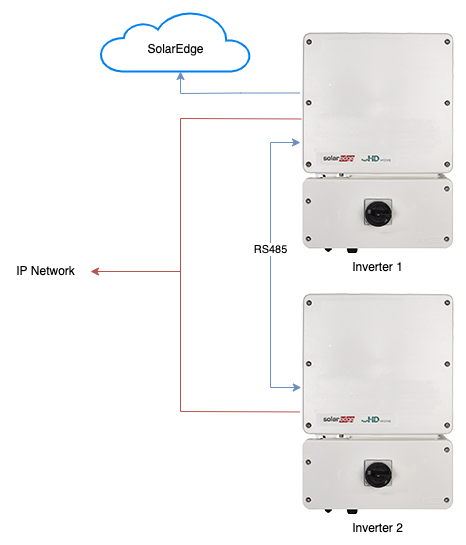
The architecture for the monitoring solution is shown below. On the right are the two inverters, both of which are connected to the IP network and connected together via RS485. Inverter #1 is configured as the Modbus leader and #2 as the follower. Inverter #1 polls data from #2 via RS485 and sends telemetry to the SolarEdge cloud which the installer and system owner can see via the SolarEdge web UI.
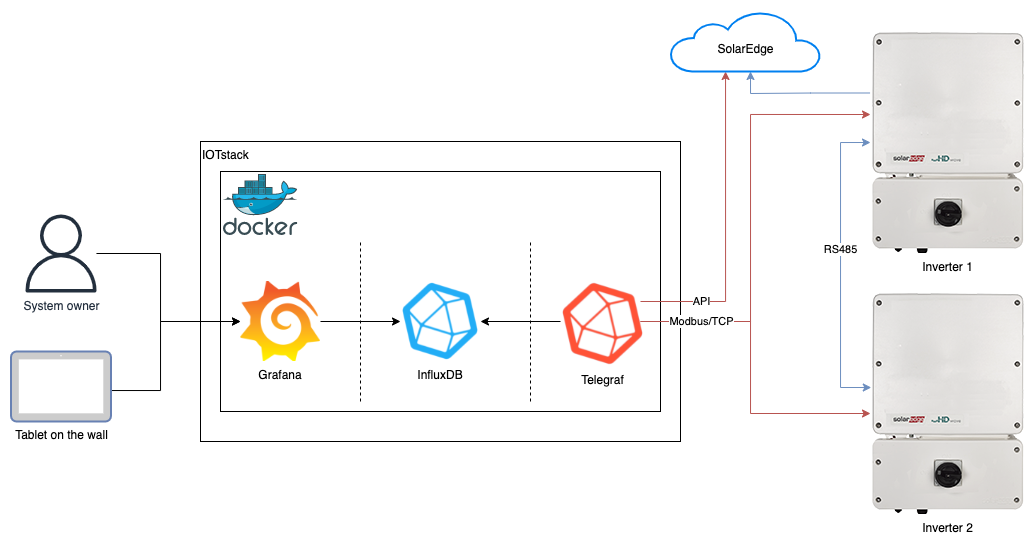
Telegraf communicates with each inverter via the IP network using Modbus/TCP. Telegraf collects the same data points from each inverter and stores it in InfluxDB using a unique InfluxDB measurement for each inverter. Once a day, Telegraf also ingests data from the SolarEdge API, primarily to collect the per-panel optimizer data which is not available via Modbus/TCP.
The data stored in InfluxDB is visualized via Grafana dashboards and can be consumed interactively by the system owner or displayed passively on a tablet or computer screen for quickly assessing system health and performance.
Working with multiple inverters⌗
As I mentioned above, I had to make a few modifications to the artifacts I was using from Nelis' blog post as well as adjust the communications settings of the inverters themselves.
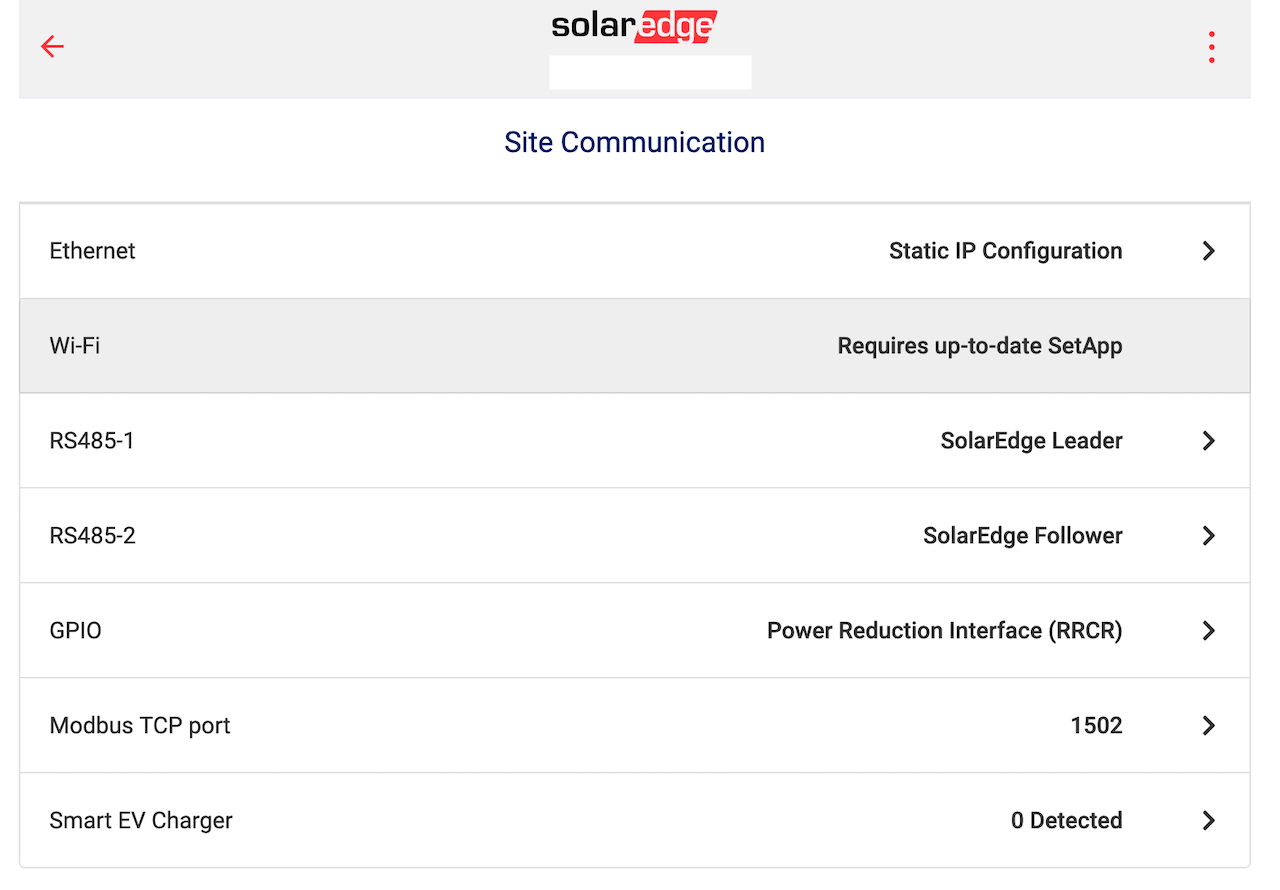
The system installer configured inverter communications like this:
- Inverter #1 is the leader, inverter #2 the follower.
- #1 collects measurements from #2 via RS485 and uses its IP network connection to send the data to the SolarEdge cloud service.
After enabling Modbus/TCP on inverter #1, I found that Modbus queries directed at inverter #1 did not return any data points from inverter #2. Oddly, I noticed in each inverter's web UI that they were both configured with the same Modbus device ID. 🤔 I also noticed they were using the SolarEdge protocol as opposed to plain Modbus and so for all I knew, the device ID was irrelevant in that operating mode. All that mattered is Telegraf wasn't getting data for inverter #2.
I decided to connect inverter #2 to the IP network and have Telegraf poll both inverters independently. Within Grafana, I could then aggregate query results where necessary. For example, when querying daily production, each inverter would return its own value which Grafana would then sum to get a total for the system.
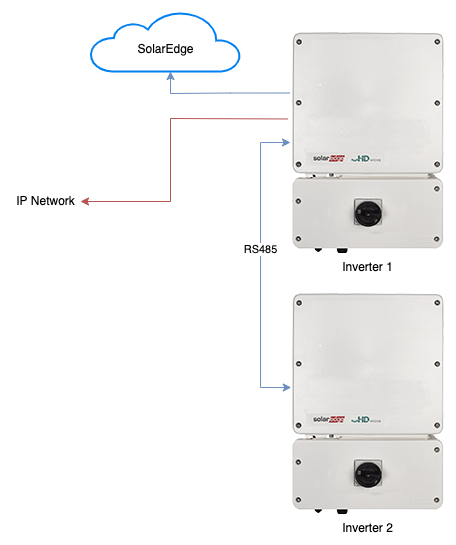
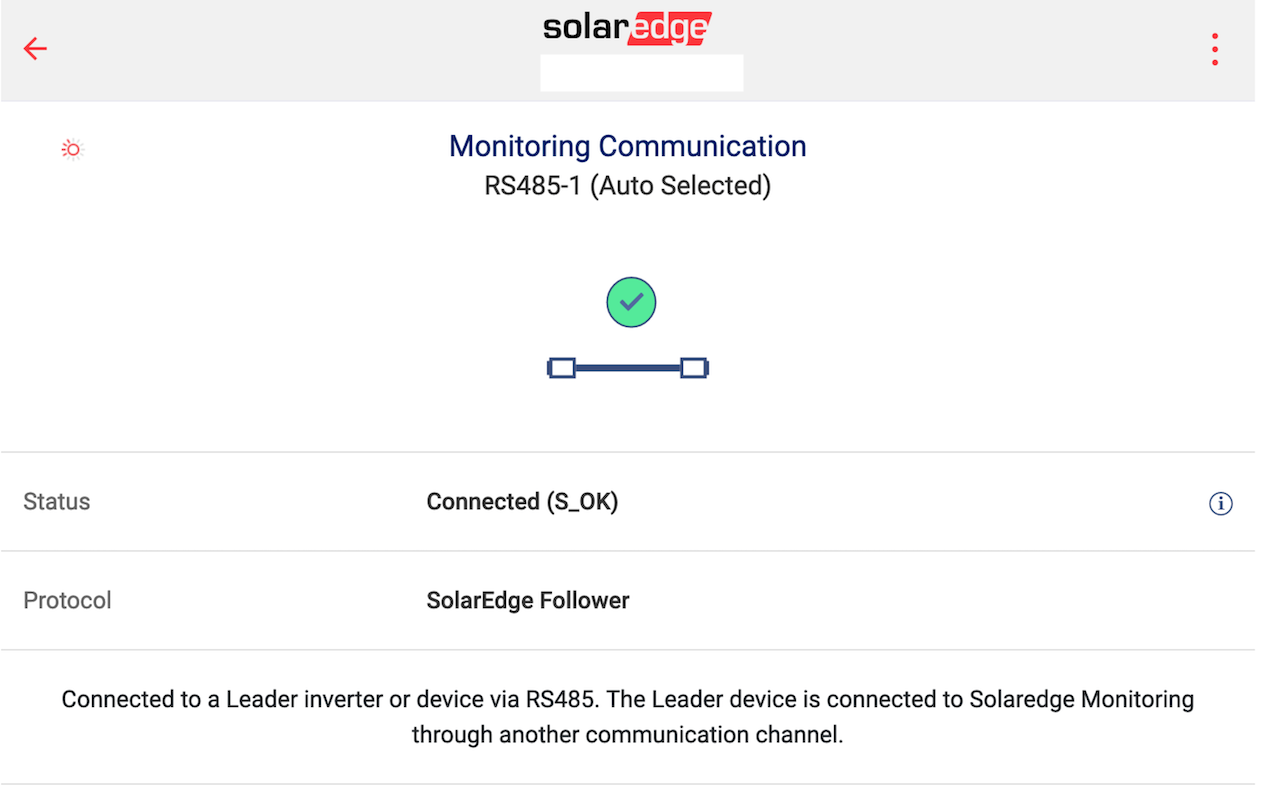
When connecting inverter #2 to the IP network, I wanted to make sure I didn't break the flow of telemetry to the SolarEdge cloud. I didn't know one way or the other if telemetry flow would break if I disconnected the RS485 connection and/or inverter #2 starting sending its own telemetry to the cloud via its IP connection. I opted for the "if it ain't broke, don't fix it" approach and configured inverter #2 to continue sending cloud telemetry via the serial connection. Thankfully, the ability to specify which comms channel to use to reach the cloud service is right there in the web UI.
In the end, inverter communications looks like this:
With the inverters all configured, I used some code from Neils Makel to test Modbus/TCP comms. Neils' solaredge_modbus repo contains a simple Python script to query a few registers from the inverter.
$ pip3 install solaredge_modbus
$ git clone https://github.com/nmakel/solaredge_modbus
$ cd solaredge_modbus
$ python3 example.py --unit 1 --json 192.168.0.250 1502
{
    "c_sunspec_did": 102,
    "current": 0,
    "p1_current": 0,
    "p2_current": 0,
    "p3_current": 0,
    "current_scale": -2,
    "p1_voltage": 2453,
    "p2_voltage": 0,
    "p3_voltage": 0,
    "p1n_voltage": 0,
    "p2n_voltage": 0,
    "p3n_voltage": 0,
    "voltage_scale": -1,
    "power_ac": 0,
    "power_ac_scale": 0,
    "frequency": 59976,
    "frequency_scale": -3,
    "power_apparent": 0,
    "power_apparent_scale": 0,
    "power_reactive": 0,
    "power_reactive_scale": 0,
    "power_factor": 0,
    "power_factor_scale": 0,
    "energy_total": 5834303,
    "energy_total_scale": 0,
    "current_dc": 0,
    "current_dc_scale": 0,
    "voltage_dc": 0,
    "voltage_dc_scale": -1,
    "power_dc": 0,
    "power_dc_scale": 0,
    "temperature": 1751,
    "temperature_scale": -2,
    "status": 2,
    "vendor_status": 0,
    "meters": {},
    "batteries": {
        "Battery1": {},
        "Battery2": {}
    }
}
$ python3 example.py --unit 1 --json 192.168.0.251 1502
{
    "c_sunspec_did": 102,
    "current": 0,
    "p1_current": 0,
    "p2_current": 0,
    "p3_current": 0,
    "current_scale": -2,
    "p1_voltage": 2455,
    "p2_voltage": 0,
    "p3_voltage": 0,
    "p1n_voltage": 0,
    "p2n_voltage": 0,
    "p3n_voltage": 0,
    "voltage_scale": -1,
    "power_ac": 0,
    "power_ac_scale": 0,
    "frequency": 59977,
    "frequency_scale": -3,
    "power_apparent": 0,
    "power_apparent_scale": 0,
    "power_reactive": 0,
    "power_reactive_scale": 0,
    "power_factor": 0,
    "power_factor_scale": 0,
    "energy_total": 5293769,
    "energy_total_scale": 0,
    "current_dc": 0,
    "current_dc_scale": 0,
    "voltage_dc": 0,
    "voltage_dc_scale": -1,
    "power_dc": 0,
    "power_dc_scale": 0,
    "temperature": 1647,
    "temperature_scale": -2,
    "status": 2,
    "vendor_status": 0,
    "meters": {},
    "batteries": {
        "Battery1": {},
        "Battery2": {}
    }
}
Seeing that I get back these registers in the output and that they have sane values, I know the inverters are properly talking Modbus/TCP on the IP network and I can move on to building the solution.
The inverters only accept one Modbus/TCP client at a time. If you try and run example.py while Telegraf or some other client is querying the inverters, the Python script will not be able to fetch any values.
Build the solution⌗
The artifacts I created for monitoring this system along with detailed documentation for using them are in my solaredge_monitoring GitHub repo. Start with the README and then dive into the BUILD_RUNBOOK.
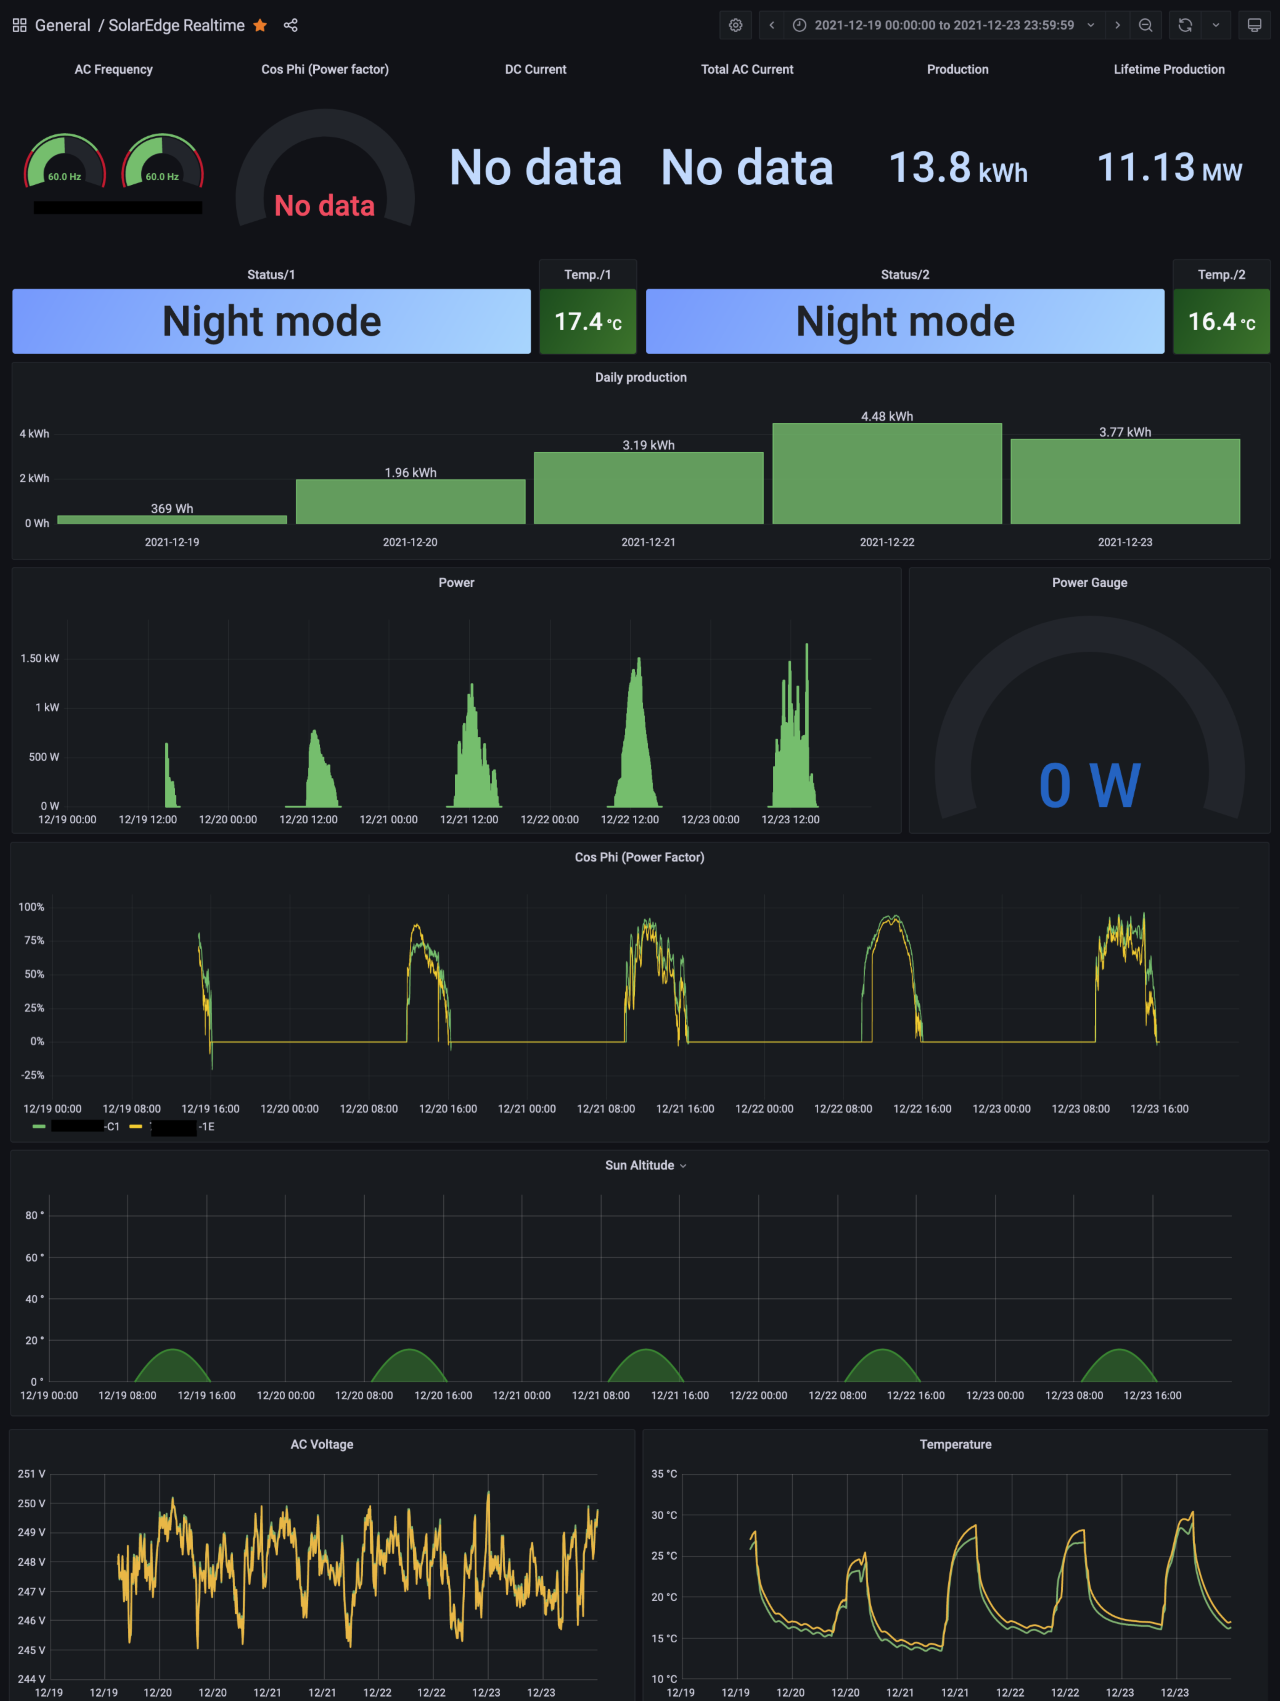
Results⌗
Once the solution is working and has had enough time to gather data, the dashboard will start to populate and look something like this:
References⌗
- SolarEdge API docs
- Enabling Modbus/TCP on SolarEdge Inverter (includes instructions for connecting to inverter web UI)
- SolarEdge Three Phase Inverter DC, Communication & AC Connection (includes instructions for wiring the inverter to the IP network)
- SolarEdge SE3000H-US Installation Manual (even though I wasn't working with this inverter, the manual has useful information about how to configure and connect to the inverter)